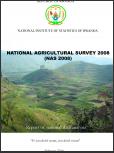
National agricultural Survey Report (NAS, 2008)
The National Agricultural Survey 2008 (NAS 2008) was designed to provide a picture with reliable and updated agriculture sector figures, in order to serve as a baseline based on the facts and to set up development strategies that are most appropriate for the rural sector. This will steer progress towards the goals of Vision 2020, while having the fittest tools for measuring, monitoring and evaluation. Indeed in the context of Vision 2020 adopted by the highest authorities of the country, the transformation of agriculture is one of the pillars of that vision.
![[title]](https://statistics.gov.rw/sites/default/files/styles/pub_small_112x150_/public/publications/71e00f61-4537-45ba-9ae2-2684d11850a8/Comprehensive%20Food%20Security%202006.jpg?itok=cVVlOt9H)
Comprehensive food security and vulnerability analysis and nutrition survey (CFSVA - 2006)
Consumer Price Index (CPI) - October 2011
In October 2011 the All Urban general index is established at 112.4 this stands for an increase of 0.58% over the previous month which was 111.8. In annual change it increased by 7.76% compared to 6.64% in the previous month. This gives a general inflation rate by an annual average of 4.4% during October 2011.
External Trade Statistics Report - Third Quarter 2011
Exports to EAC Partner States increased by 65.7 per cent from US$ 9.88 million in the third quarter of 2010 to US$ 16.37 million in 2011 in the same quarter. The decrease from the second quarter level of 2011 is 17.1 per cent. KENYA was the main destination of RWANDA with the share of 84.8 per cent of the total exports to EAC region, followed by Burundi and Uganda for 9.3 and 5.1 per cent respectively.
Statistical YearBook 2011
This edition shows the now available data for thirteen fields namely: Population, Vital Statistics and Gender; Health and Nutrition; Education; Environment; Agriculture; Energy and Water Production;Transportation and Communication; Travel and Tourism; Income, Expenditure and Wealth; Price Indexes; Banking, Finance, Insurance; Business Enterprise and Foreign Trade; and finally Law Enforcement, Courts and Prisons.
Consumer Price Index Report (September 2011)
In September 2011 the All Urban general index is established at 111.8 this stands for an increase of 0.39% over the previous month which was 111.3. In annual change it increased by 6.64% compared to 7.52% in the previous month. This gives a general inflation rate by an annual average of 3.7% during the month of September 2011.
![[title]](https://statistics.gov.rw/sites/default/files/styles/pub_small_112x150_/public/publications/9547f498-1f6b-455c-a200-88b815d9fdd2/DHS_Key-Findings_1992_001.jpg?itok=QA_O1Hd-)
Rwanda Demographic and Health Survey (DHS - 1992)
Rwanda Demographic and Health Survey (DHS - 2000)
This report summarizes the findings of the Rwanda Demographic and Health Survey (RDHS-II 2000). The second undertaking of this type, the RDHS-II is a nationally representative survey conducted from June to November 2000 by the National Office of Population.
Population and Housig Census 2002
![[title]](https://statistics.gov.rw/sites/default/files/styles/pub_small_112x150_/public/publications/08558963-609f-484b-88e7-cab8d9be4fb8/cover-EICV.jpg?itok=yv_aCwa8)